The Public Opinion of Forestry Survey is carried out every two years and obtains people’s attitudes to forestry and forestry-related issues, including visits to woodland. Copies of reports and detailed data tables are available at www.forestresearch.gov.uk/tools-and-resources/statistics/statistics-by-topic/public-opinion-of-forestry/.
The results shown in Tables 6.4 and 6.5 and Figure 6.1 have been taken from the UK and country reports on the latest surveys in 2019 and from surveys in earlier years. The reports also include other recreation-related results, such as whether the woodlands visited were in towns or the countryside and any reasons given by survey respondents for not visiting woodlands.
In the UK 2019 survey, over three fifths (63%) of respondents said that they had visited woodland in the last few years for walks, picnics or other recreation (Table 6.4).
Table 6.4 Woodland visitors1
| Year |
England |
Wales |
Scotland |
Northern Ireland |
UK |
| per cent of respondents |
| 2003 |
66 |
62 |
64 |
77 |
67 |
| 2005 |
65 |
69 |
50 |
67 |
65 |
| 2007 |
76 |
79 |
75 |
62 |
77 |
| 2009 |
77 |
.. |
57 |
.. |
77 |
| 2010 |
.. |
.. |
.. |
72 |
.. |
| 2011 |
68 |
68 |
75 |
.. |
67 |
| 2013 |
65 |
64 |
76 |
.. |
66 |
| 2014 |
.. |
.. |
.. |
75 |
.. |
| 2015 |
55 |
64 |
78 |
.. |
56 |
| 2017 |
62 |
72 |
84 |
.. |
61 |
| 2019 |
63 |
77 |
.. |
78 |
63 |
Source: UK/GB, Scotland, Wales and Northern Ireland Public Opinion of Forestry Surveys
Base: UK/GB = 4,000 respondents (2003 to 2007), 2,000 respondents (2009 to 2019);
Scotland and Wales = 1,000 respondents each;
Northern Ireland = 120 respondents (2003), 1,000 respondents (all other years).
Notes:
1. Those stating that they had visited woodland in the last few years.
2. The range of uncertainty around any result should be no more than ±3.5% (for surveys with around 2,000 respondents) and ±4.7% (for surveys with around 1,000 respondents). To compare results over time, a difference of at least 5 percentage points (for surveys each with around 2,000 respondents) and at least 7 percentage points (for surveys each with around 1,000 respondents) is required to indicate that there is a significant difference.
.. Denotes data not available (survey not run that year or question not asked)
These figures are outside the scope of National Statistics. For further information see the Sources chapter.
Survey respondents were asked how frequently they had visited during the previous summer and winter. Figure 6.1, which presents aggregated UK results for the 2015 to 2019 surveys, shows that respondents visited much more often during the summer, with 44% of respondents visiting at least once a month in the summer compared to around one quarter (27%) in the winter.
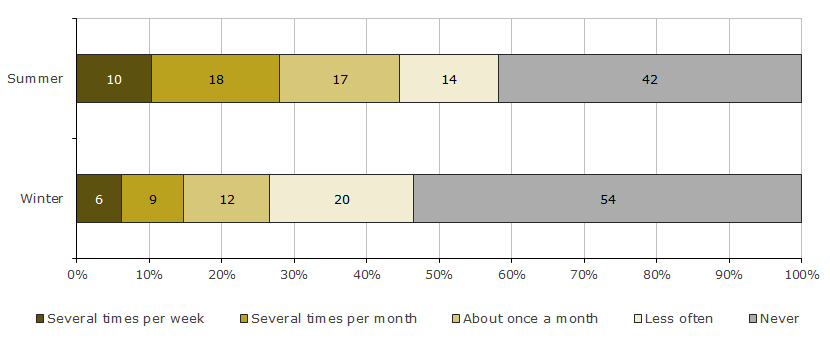
Source: UK Public Opinion of Forestry Surveys, 2015 to 2019.
Base: Average visit frequencies from last three UK surveys: 2,000 respondents per survey.
Notes:
1. The range of uncertainty around any result should be no more than ±3.5% in any individual year and ±1.1% for the 3 surveys combined.
These figures are outside the scope of National Statistics. For further information see the Sources chapter.