Tools and Resources
The global forest area reduced by around 7.3 million hectares (0.2%) per year between 1990 and 2000, by around 4.0 million hectares (0.1%) per year between 2000 and 2010 and by around 3.3 million hectares (0.1%) per year between 2010 and 2015 (Table 9.2).
The forest area has reduced in most regions since 1990, except for Europe (where the area increased in each time period) and Asia (where the area reduced between 1990 and 2000 but has increased by more between 2000 and 2015).
| Region | 1990-2000 | 2000-2010 | 2010-2015 | |||
|---|---|---|---|---|---|---|
| (thousand ha) | (%) | (thousand ha) | (%) | (thousand ha) | (%) | |
| Europe | ||||||
| UK | 18 | 0.6 | 11 | 0.3 | 17 | 0.5 |
| EU-281 | 681 | 0.5 | 450 | 0.3 | 369 | 0.2 |
| Total Europe | 803 | 0.1 | 1 127 | 0.1 | 382 | 0.0 |
| Africa | -3 537 | -0.5 | -3 209 | -0.5 | -2 836 | -0.4 |
| Asia | -221 | 0.0 | 2 349 | 0.4 | 791 | 0.1 |
| North and Central America | -394 | -0.1 | 172 | 0.0 | 75 | 0.0 |
| Oceania | 82 | 0.0 | -564 | -0.3 | 304 | 0.2 |
| South America | -4 000 | -0.4 | -3 868 | -0.4 | -2 024 | -0.2 |
| World | -7 267 | -0.2 | -3 993 | -0.1 | -3 308 | -0.1 |
Source: FAO Global Forest Resources Assessment 2015.
Notes:
1. Cyprus is included in EU-28 total but is part of FAO’s Asia region.
These figures are outside the scope of National Statistics
Between 2010 and 2015, the largest decrease in forest area was in Brazil (1.0 million hectares per year on average) and the largest increase was in China (1.5 million hectares per year on average) (Figure 9.3).
Figure 9.3 Countries with the largest changes in forest area, 2010-2015
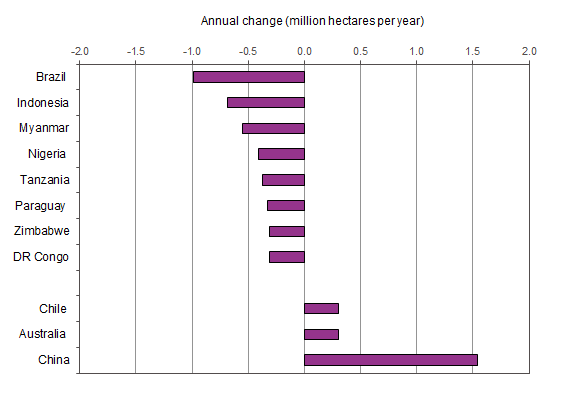
Source: FAO Global Forest Resources Assessment 2015.
Notes:
1. Countries with changes of at least 0.3 million hectares per year only.
These figures are outside the scope of National Statistics