Timber Price Indices are based on sales of softwood (conifers) by Forestry England, Forestry and Land Scotland and Natural Resources Wales and are released every 6 months.
The Coniferous Standing Sales Price Index monitors changes in the average price received per cubic metre for timber that Forestry England/ Forestry and Land Scotland/ Natural Resources Wales sold standing, where the purchaser is responsible for harvesting.
The Softwood Sawlog Price Index monitors changes in the average price received per cubic metre of sawlogs (roundwood with a top diameter of 14 cm or more, destined to be sawn into planks or boards) sold at roadside by Forestry England/ Forestry and Land Scotland/ Natural Resources Wales.
Standing timber and sawlogs are distinct markets, and may show different price movements. The data are averages for historic periods, so may be slow to show any turning points.
These indices are used to monitor trends in timber prices and to provide information on the state of the UK timber industry. They are also used by the UK timber industry, alongside other economic indicators, in contract reviews.
There is little other information currently available on wood prices before primary processing and no price index is available for broadleaves. Prices for outputs of primary wood processing are collected by the Office for National Statistics (ONS) in the Producer Price Indices (PPIs), and these are available in the MM22 dataset which gives detailed PPIs monthly.
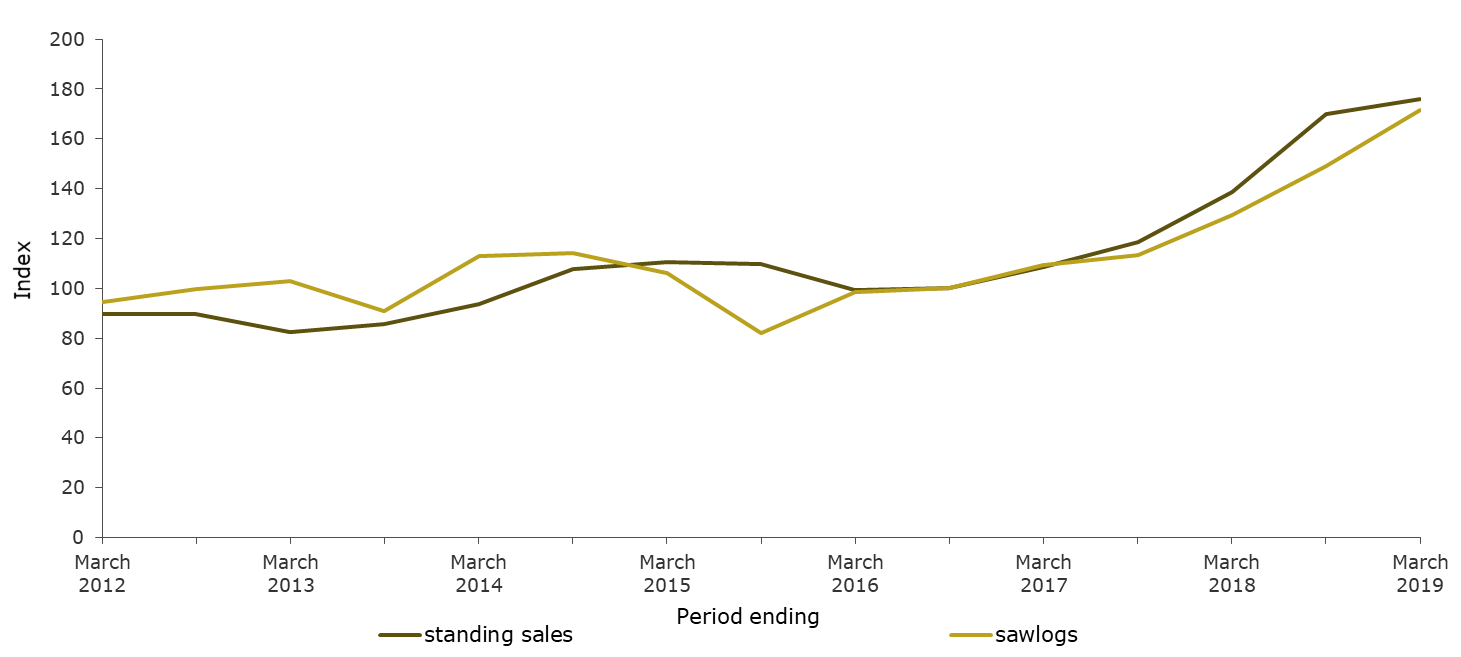
Table 8.1 presents the coniferous standing sales and sawlog price indices for Great Britain to March 2019.
The coniferous standing sales price index for Great Britain was 26.8% higher in real terms in the year to March 2019, compared with the previous year (Table 8.1). The softwood sawlog price index was 32.5% higher in real terms in the 6 months to March 2019, compared with the corresponding period in the previous year.
Table 8.1 Coniferous standing sales and sawlog price indices1 for Great Britain, 2012-2019
| Period ending March |
Standing sales2 |
Sawlogs |
| |
Nominal terms3 |
Real terms4 |
Nominal terms3 |
Real terms4 |
| index (period to September 2016 = 100) |
| 2012 |
83.9 |
89.7 |
88.2 |
94.6 |
| 2013 |
78.6 |
82.4 |
97.9 |
102.8 |
| 2014 |
90.9 |
93.6 |
109.5 |
113.1 |
| 2015 |
108.8 |
110.6 |
103.2 |
106.0 |
| 2016 |
98.5 |
99.4 |
97.1 |
98.6 |
| 2017 |
110.0 |
108.5 |
110.8 |
109.4 |
| 2018 |
143.5 |
138.7 |
133.9 |
129.6 |
| 2019 |
185.5 |
175.9 |
180.6 |
171.7 |
Source: Timber Price Indices: data to March 2019
Notes:
1. The price indices are constructed from information on sales by Forestry England/ Forestry and Land Scotland/ Natural Resources Wales only.
2. The standing sales index uses the Fisher method with 5 year chain linking to take account of changes in the size mix over time.
3. Nominal prices are the actual prices at that point in time.
4. Real terms values are obtained by using the GDP deflator to convert to “constant prices” (in this case prices in 2016). This allows trends in timber prices to be tracked without the influence of inflation.
5. The standing sales index excludes sales by Natural Resources Wales from April 2017.
6. Sawlog prices in Wales in the year to March 2018 include long term contract rates for the clearance of infected larch.
Source: Timber Price Indices: data to March 2019
Notes:
1. The price indices are constructed from information on sales by the Forestry England/ Forestry and Land Scotland/ Natural Resources Wales only.
2. The standing sales index uses the Fisher method with 5 year chain linking to take account of changes in the size mix over time.
3. Real terms values are obtained by using the GDP deflator to convert to “constant prices” (in this case prices in 2016). This allows trends in timber prices to be tracked without the influence of inflation.
4. The standing sales index excludes sales by Natural Resources Wales from April 2017.
5. Sawlog prices in Wales in the year to March 2018 include long term contract rates for the clearance of infected larch.