Tools and Resources
We use some essential cookies to make this website work.
We’d like to set additional cookies to understand how you use forestresearch.gov.uk, remember your settings and improve our services.
We also use cookies set by other sites to help us deliver content from their services.
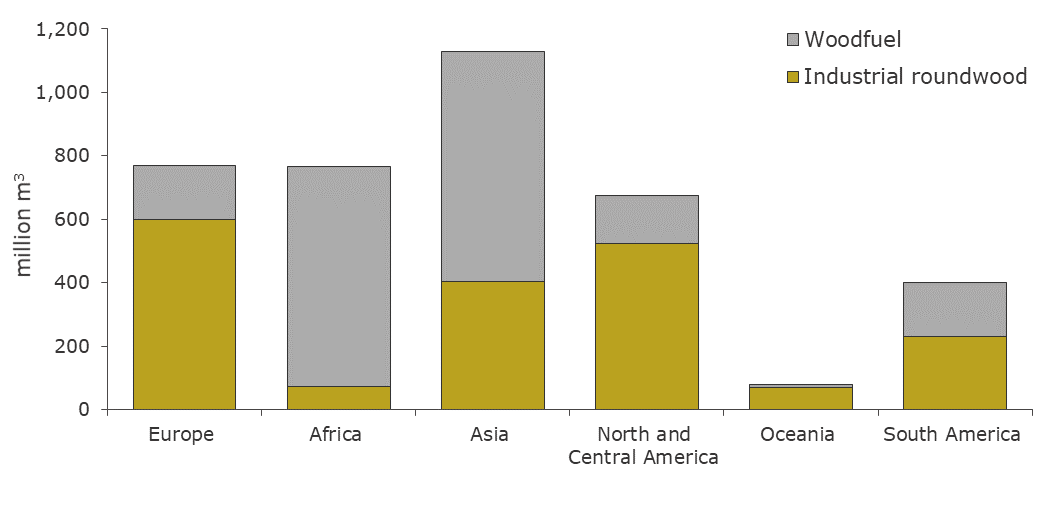
A total of 3.8 billion m3 underbark of wood was removed from global forests in 2017, of which around one half (50%) was for use as woodfuel and the remainder was industrial roundwood (for use by wood processors) (Table 9.4).
North & Central America and Europe together accounted for around three fifths (59%) of all industrial roundwood removals in 2017. Globally, removals of industrial roundwood increased by 3% between 2015 and 2017, resulting from increases in all regions.
Three quarters (74%) of woodfuel removals in 2017 took place in Asia and Africa. Globally, removals of woodfuel increased by 2% between 2015 and 2017.
| Region | 1990 | 2000 | 2010 | 2015 | 2017 |
| million m3 underbark | |||||
| Industrial roundwood | |||||
| Europe | |||||
| UK | 6 | 8 | 8 | 9 | 9 |
| EU-281 | 317 | 344 | 338 | 351 | 362 |
| Total Europe | 517 | 521 | 531 | 579 | 599 |
| Africa | 61 | 71 | 72 | 75 | 74 |
| Asia | 268 | 269 | 370 | 389 | 405 |
| North and Central America | 595 | 632 | 485 | 516 | 523 |
| Oceania | 34 | 47 | 58 | 63 | 70 |
| South America | 110 | 147 | 198 | 217 | 231 |
| World | 1585 | 1688 | 1713 | 1840 | 1903 |
| Woodfuel | |||||
| Europe | |||||
| UK | 0 | 0 | 1 | 2 | 2 |
| EU-281 | 68 | 79 | 98 | 109 | 119 |
| Total Europe | 138 | 103 | 136 | 157 | 170 |
| Africa | 445 | 551 | 643 | 679 | 693 |
| Asia | 897 | 808 | 764 | 735 | 725 |
| North and Central America | 162 | 129 | 129 | 136 | 153 |
| Oceania | 9 | 13 | 11 | 10 | 10 |
| South America | 162 | 185 | 162 | 171 | 169 |
| World | 1814 | 1789 | 1845 | 1889 | 1920 |
| Total roundwood | |||||
| Europe | |||||
| UK | 6 | 8 | 10 | 11 | 11 |
| EU-281 | 385 | 423 | 435 | 460 | 481 |
| Total Europe | 655 | 624 | 667 | 736 | 769 |
| Africa | 506 | 623 | 715 | 754 | 767 |
| Asia | 1166 | 1077 | 1134 | 1125 | 1130 |
| North and Central America | 757 | 761 | 613 | 652 | 676 |
| Oceania | 43 | 60 | 68 | 73 | 80 |
| South America | 272 | 332 | 359 | 388 | 400 |
| World | 3399 | 3477 | 3557 | 3729 | 3823 |
Source: FAO.
Notes:
1. Cyprus is included in EU-28 total but is part of FAO’s Asia region.
These figures are outside the scope of National Statistics. For further information see the Sources chapter.

Source: FAO.
These figures are outside the scope of National Statistics. For further information see the Sources chapter.
Sources chapter: International Forestry
Cookies are files saved on your phone, tablet or computer when you visit a website.
We use cookies to store information about how you use the dwi.gov.uk website, such as the pages you visit.
Find out more about cookies on forestresearch.gov.uk
We use 3 types of cookie. You can choose which cookies you're happy for us to use.
These essential cookies do things like remember your progress through a form. They always need to be on.
We use Google Analytics to measure how you use the website so we can improve it based on user needs. Google Analytics sets cookies that store anonymised information about: how you got to the site the pages you visit on forestresearch.gov.uk and how long you spend on each page what you click on while you're visiting the site
Some forestresearch.gov.uk pages may contain content from other sites, like YouTube or Flickr, which may set their own cookies. These sites are sometimes called ‘third party’ services. This tells us how many people are seeing the content and whether it’s useful.