What threats may challenge the system’s ability to persist in its current or desired state?
These may be biotic (e.g. pests), abiotic (e.g. drought), or social/economic/political (e.g. built development pressure) threats, shocks and stresses, as shown in the table below. Some threats may be commonplace and manageable, while others may represent an unacceptable challenge to your system. Some may be negatively impacting your system already, whereas others may not yet be present. Threats can also interact (e.g. climate change and disease) leading to further disturbance.
Example systems and threats for Step 2
|
Main category of threats
|
Publicly managed multi-functional forest
|
Restoration site (plantation on ancient woodland site) managed by conservation organisation
|
|
Biotic (biological)
|
- Mammals (e.g. squirrel and deer)
- Insect pests (e.g. pine weevils)
- Plant disease impacting species choice (e.g. Dothistroma needle blight affecting Corsican pine)
|
- Mammals (e.g. squirrel and deer)
- Current and new insect pests and diseases
- Loss of natural processes (e.g. woody debris)
|
|
Abiotic (physical/chemical)
|
- Pollution (excessive atmospheric nitrogen deposition)
- Climate change (wetter/warmer winters and hotter/drier summers) impacting fire risk and water availability
|
- Climate change (in particular high rainfall events becoming more frequent, and coupled with the steep terrain causing erosion and flooding)
|
|
Social / economic / political
|
- Reduction in value of timber markets
- Future food security may involve land-use change from forest to agriculture
- Recreational disturbance to ground nesting birds
|
- Opposition to thinning and felling (limits the options for building irregularity into the even-aged stands)
- Increased competition for funding internally and from other charities
|
Note: see more examples on the Research Implementation Framework – template
Hints and tips for Step 2
- On the first attempt, treat this step as a brainstorming exercise. Evaluation of actions, prioritisation and synergies etc. can take place later.
- You may want to add further columns to the example table above to include:
- (i) What is the likely frequency of the threat within the timescale of interest, and does the severity increase and decrease in ‘pulses’ or is it more prolonged and ongoing?
- (ii) Are there synergistic effects in which one threat acts to increase the impact of another (e.g. the potentially increased susceptibility of stressed trees to secondary pests/diseases)?
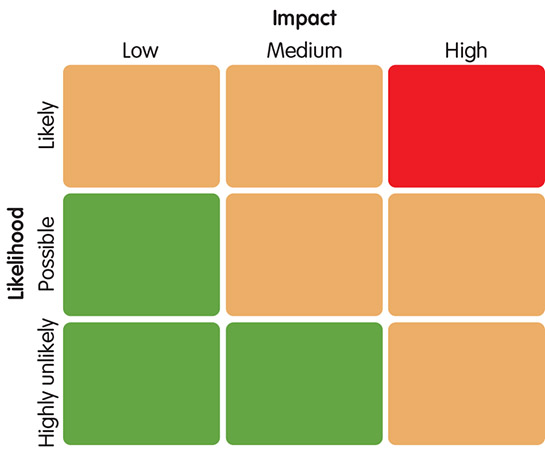
- After threat identification, you may want to use a matrix to order by impact and likelihood. The focus should be on high/medium risk threats in the red and amber sections in the diagram below. The categories can be expanded to fit your circumstances.
- Look back at the system identified in Step 1. Do the threats match the defined system?

