The 3.16 million hectares of woodland in the UK in 2016 represents 13% of the total land area. This comprises 10% in England, 15% in Wales, 18% in Scotland and 8% in Northern Ireland (Table 1.2).
Table 1.2 Woodland area in the United Kingdom
| Year |
England |
Wales |
Scotland |
Northern Ireland2 |
UK |
|
Area
(000 ha) |
%1 |
Area
(000 ha) |
%1 |
Area
(000 ha) |
%1 |
Area
(000 ha) |
%1 |
Area
(000 ha) |
%1 |
| 1086 |
.. |
~15 |
.. |
.. |
.. |
.. |
.. |
.. |
.. |
.. |
| c1350 |
.. |
~10 |
.. |
.. |
.. |
~4 |
.. |
.. |
.. |
;.. |
| 17thC |
.. |
~8 |
.. |
.. |
.. |
~4 |
.. |
~1.5 |
.. |
.. |
| 1905 |
681 |
5.2 |
88 |
4.2 |
351 |
4.5 |
15 |
1.1 |
1 140 |
4.7 |
| 1924 |
660 |
5.1 |
103 |
5.0 |
435 |
5.6 |
13 |
1.0 |
1 211 |
5.0 |
| 1947 |
755 |
5.8 |
128 |
6.2 |
513 |
6.6 |
23 |
1.7 |
1 419 |
5.9 |
| 1965 |
886 |
6.8 |
201 |
9.7 |
656 |
8.4 |
42 |
3.1 |
1 784 |
7.4 |
| 1980 |
948 |
7.3 |
241 |
11.6 |
920 |
11.8 |
67 |
4.9 |
2 175 |
9.0 |
| 1995-99 |
1 097 |
8.4 |
287 |
13.8 |
1 281 |
16.4 |
81 |
6.0 |
2 746 |
11.3 |
| 20163,4 |
1 306 |
10.0 |
306 |
14.8 |
1 436 |
18.4 |
112 |
7.8 |
3 160 |
13.0 |
Source: Forestry Commission, Natural Resources Wales, Forest Service, National Forest Inventory.
Notes:
1. Percentage of the total surface area excluding inland water. The total surface areas, excluding inland water, are taken from the UK Standard Area Measurements (published by the Office for National Statistics).
2. For Northern Ireland, 17th century figure is estimate for all Ireland, 1905 figure is estimate for Ulster 1908, 1947 figure assumes no change from 1939-40 Census.
3. Figures for England, Wales and Scotland are based on data obtained from the National Forest Inventory (NFI) and adjusted for new planting, but at present no adjustment is made for woodland recently converted to another land use. Further information on how the figures have been estimated is available in the Sources chapter.
4. Figures for Northern Ireland are obtained from the Northern Ireland Woodland Register.
.. Denotes data not available.
These figures are outside the scope of National Statistics
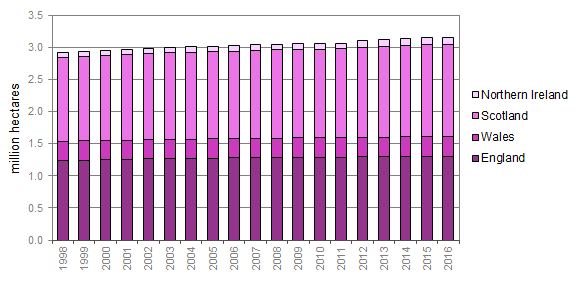
Figure 1.1 shows woodland area by country since 1998. Figures for 1998 to 2009 for England, Wales and Scotland have been revised from those initially published, to produce results that are consistent with the National Forest Inventory and enable comparisons over time. The chart indicates that the UK woodland area has risen by around 240 thousand hectares since 1998, an increase of 8% over the period.
Figure 1.1 Area of woodland, 1998-2016
Source: Forestry Commission, Natural Resources Wales, Forest Service, National Forest Inventory.
Notes:
1. Woodland areas for England, Wales and Scotland shown in this figure are based on data from the National Forest Inventory. The trends shown take account of areas of new planting and identifiable permanent woodland loss. Areas of woodland loss that are not yet identifiable (e.g. conversion of woodland for the restoration of open habitats) are not accounted for. Further information on the National Forest Inventory is available at www.forestry.gov.uk/inventory.
These figures are outside the scope of National Statistics