Bird populations provide a good indication of the broad state of wildlife in the UK. This is because they are a well-studied taxonomic group, enabling a more informed interpretation of observed changes, who occupy a range of habitats while still responding to the same environmental pressures that also operate on other groups of wildlife.
Indices of wild bird populations in the UK are produced annually by the Department for Environment, Food and Rural Affairs (Defra) in conjunction with the Royal Society for the Protection of Birds (RSPB), the British Trust for Ornithology (BTO) and the Joint Nature Conservation Committee (JNCC), and cover a range of species that are native to the UK. This data has been produced since the early 1970s for the majority of habitat groups, meaning there is considerable long-term data available on the changes in bird populations, which aids in the interpretation of more short term variation.
The index for woodland birds was expanded in 2007 to cover 38 species. A further change in 2015 resulted in a reduction to 37 species, of which 12 are generalists and 25 are woodland specialists (those that breed or feed mainly or solely in woodland).
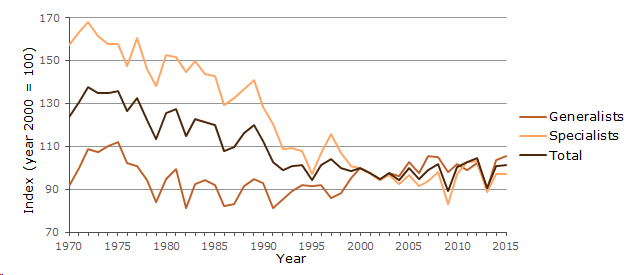
Since the early 1990s, when the majority of species group indices stabilised, the UK woodland bird index has generally been about 20 per cent below the level of the early 1970s, with the decline predominantly in woodland specialist species (Figure 5.1). The vast majority of species groups have decreased in a similar fashion with two key exceptions, these being the woodland generalists and slow stand wetlands, although neither of these groups has increased enough to offset the decrease in the other woodland or wetland groups. In recent years (Table 5.1, Figure 5.1), there has been an overall increase in the index for woodland birds, and both associated subgroups, at a higher rate than that for the all bird index.
Causes for the long term decline in the woodland bird index may include a lack of diversity in habitats and food sources, loss of habitats and food sources through damage caused by increasing deer populations, and a reduction in some migratory species following pressures in other parts of the world.
Table 5.1 UK populations of wild birds.
| Year | Total breeding birds | Farmland birds | Seabirds | Woodland birds | Woodland generalists | Woodland specialists |
| index (year 2000 = 100) | ||||||
| 2006 | 99.7 | 96.2 | 94.4 | 94.6 | 97.4 | 91.4 |
| 2007 | 98.7 | 90.3 | 89.0 | 99.0 | 105.6 | 93.8 |
| 2008 | 100.3 | 92.2 | 83.5 | 101.8 | 105.1 | 98.1 |
| 2009 | 95.7 | 89.5 | 89.4 | 89.2 | 98.0 | 83.0 |
| 2010 | 97.4 | 86.7 | 86.5 | 100.3 | 102.0 | 97.1 |
| 2011 | 95.7 | 86.3 | 80.8 | 102.9 | 98.8 | 102.9 |
| 2012 | 96.9 | 87.3 | 78.0 | 104.3 | 102.3 | 103.3 |
| 2013 | 89.7 | 78.8 | 76.9 | 90.5 | 89.9 | 88.5 |
| 2014 | 96.7 | 80.3 | 84.3 | 100.7 | 103.6 | 97.3 |
| 2015 | 101.1 | 85.4 | 81.6 | 101.4 | 105.7 | 97.3 |
Source: British Trust for Ornithology (BTO), Department for Environment, Food and Rural Affairs (Defra), Joint Nature Conservation Committee (JNCC), Royal Society for the Protection of Birds (RSPB).
Notes:
1. Based on data in Wild Bird Populations in the UK statistical release (Defra, June 2017 revised).
Figure 5.1 UK populations of woodland birds
Source: British Trust for Ornithology (BTO), Department for Environment, Food and Rural Affairs (Defra), Joint Nature Conservation Committee (JNCC), Royal Society for the Protection of Birds (RSPB).
Notes:
1. Based on data in Wild Bird Populations in the UK statistical release (Defra, June 2017 revised)