Returns to investors in forestry are made up of sales of timber (standing or felled), sales of other goods and services, increases in the value of the woodland (from annual increment or market factors), and the net income from subsidies (e.g. planting grants) less taxes. The investors’ costs are made up of employment costs and other purchases.
Estimates of the overall return from commercial forestry are produced annually in the Investment Property Databank (IPD) UK Forestry Index, available at www.msci.com/www/ipd-factsheets/ipd-uk-annual-forestry-index/0163322597. The index is calculated from a sample of around 150 private sector coniferous plantations of predominantly Sitka spruce in mainland Britain. The IPD UK Forestry Index is outside the scope of National Statistics.
The index shows a total return of 13.3% per annum for the three-year period 2014 to 2016, and an annual return of 10.7% for 2016 (Table 8.2).
Table 8.2 IPD UK Forestry Index: Returns from forestry, 2007-2016
| Period ending |
Index (1992=100) |
Annual % return |
3 year return (annual average %) |
| 2007 |
211.5 |
31.6 |
22.0 |
| 2008 |
226.5 |
7.1 |
19.3 |
| 2009 |
251.9 |
11.2 |
16.1 |
| 2010 |
304.2 |
20.8 |
12.9 |
| 2011 |
404.2 |
32.9 |
21.3 |
| 2012 |
479.6 |
18.6 |
23.9 |
| 2013 |
551.2 |
14.9 |
21.9 |
| 2014 |
653.6 |
18.6 |
17.4 |
| 2015 |
725.2 |
10.9 |
14.8 |
| 2016 |
802.6 |
10.7 |
13.3 |
Source: IPD UK Forestry Index
These figures are outside the scope of National Statistics
Figure 8.2 IPD UK Forestry Index: Returns from forestry
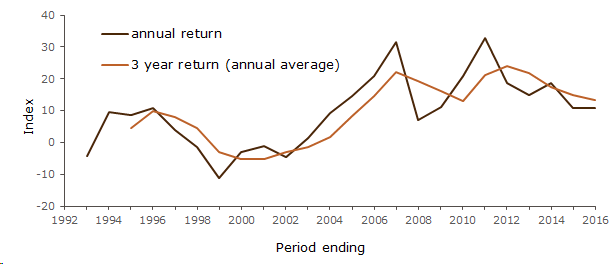
Source: IPD UK Forestry Index
Note:
1. Data collected for the IPD UK Forestry Index started in 1992
These figures are outside the scope of National Statistics