In climate change reporting, removals to forestland, also called the forest sink, measures the net annual accumulation of carbon in forests by woody biomass, soils and litter. Table 4.2 and Figure 4.2 show estimates and projections of net carbon dioxide removals attributed to UK forestry, from 1990 to 2020.
In the longer term, the annual rate is projected to peak around 2030 a 19 million tonnes CO2 in total, of which 13 million tonnes CO2 is projected to accumulate in living biomass. The rate of accumulation is expected to fall steadily after 2030.
Under the Kyoto protocol, additional woodland planted since 1990 contributes to the UK’s carbon dioxide emissions target; the rate of accumulation of carbon in these new woodlands continues to increase as woodland continues to be planted.
Reported figures do not include carbon in harvested wood products.
Table 4.2 Net carbon dioxide removals attributed to UK forestry
| Year |
In living biomass |
Total |
of which, due to land
afforested since 1990 |
emissions due to land deforested since 1990 |
| million tonnes of carbon dioxide per year |
| 1990 |
9.0 |
16.0 |
0.0 |
-0.2 |
| 1995 |
7.8 |
15.6 |
0.4 |
-0.2 |
| 2000 |
9.5 |
17.1 |
1.0 |
-0.9 |
| 2005 |
11.0 |
18.7 |
1.7 |
-1.1 |
| 2010 |
10.3 |
17.8 |
2.6 |
-1.0 |
| 2015 |
10.7 |
17.4 |
3.5 |
-1.1 |
| 2020 |
11.6 |
18.2 |
4.3 |
-0.8 |
Source: Inventory and projections of UK emissions by sources and removal by sinks due to land use, land use change and forestry, produced by the Centre for Ecology and Hydrology for input to 2013 final UK Greenhouse Gas Emissions (Department of Energy & Climate Change, February 2015).
Notes:
1. Net annual accumulation of carbon in forests by woody biomass, soils and litter. Adjusted for losses from deforestation and forest wildfires. Excludes changes in UK harvested wood products.
2. Emissions and sequestration can be presented as tonnes carbon or tonnes carbon dioxide (CO2). To convert from tonnes CO2 to tonnes carbon multiply by 12/44.
3. Future predictions of carbon uptake assume that commercial conifer plantations will be replanted when felled, and that planting of new woodland will follow a mid-projection whereby planting will increase slightly from current levels until 2022, when it will decrease to just below current levels up to 2050.
These figures are outside the scope of National Statistics
Figure 4.2 Net annual change in carbon (CO2 equivalent) 1 in UK woodlands
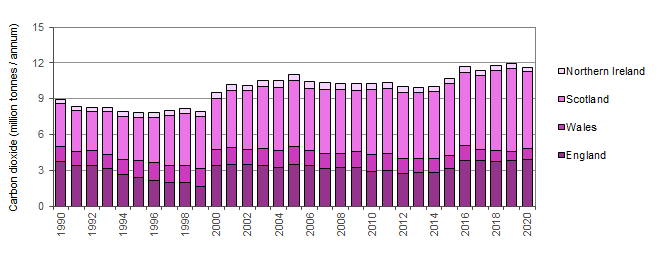
Source: Inventory and projections of UK emissions by sources and removal by sinks due to land use, land use change and forestry, produced by the Centre for Ecology and Hydrology for input to 2013 final UK Greenhouse Gas Emissions (Department of Energy & Climate Change, February 2015).
Notes:
1. Net annual accumulation of carbon in forests in living biomass only. Adjusted for losses due to deforestation and forest wildfires. Excludes changes in carbon in litter, soils and UK harvested wood products.
2. Emissions and sequestration can be presented as tonnes carbon or tonnes carbon dioxide (CO2). To convert from tonnes CO2 to tonnes carbon multiply by 12/44.
3. Future predictions of carbon uptake assume that commercial conifer plantations will be replanted when felled, and that planting of new woodland will follow a mid-projection whereby planting will increase slightly from current levels until 2022, when it will decrease to just below current levels up to 2050.
These figures are outside the scope of National Statistics.