The 2003 results are presented here in terms of crown densities rather than the crown density reductions reported for the forest condition surveys undertaken between 1987 and 2001. For an explanation of this change, and of how to convert the current figures to crown density reductions, the report of the 2002 survey should be consulted (Hendry et al. 2003).
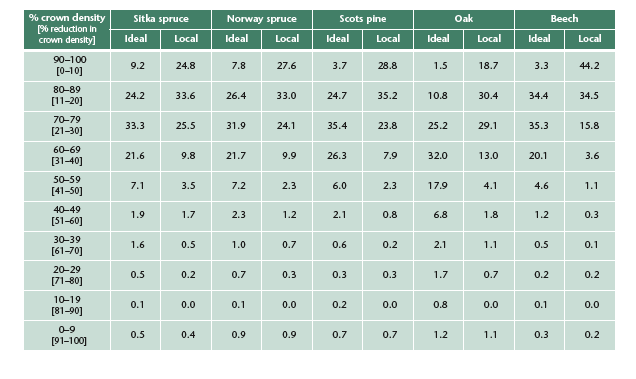
The marked effect of using a local reference tree rather than an ideal tree as a standard for comparison can be seen in Table 1, where the results obtained in 2003 using both methods of crown density assessment are presented. A greater proportion of trees receive high density scores when compared with a ‘local’ rather than an ‘ideal’ standard. This difference can largely be accounted for by variations in growth habit between the reference photographs of ideal trees (Innes, 1990) and the trees in and around the plots to be assessed, from among which a local reference tree is chosen. For example, young trees of all species tend to have amore open appearance (i.e. a lower crown density) than the older trees illustrated in Innes (1990). Some older oaks and spruces also have a naturally open structure. The crown density scores allotted to trees like these are much lower when compared to an ideal tree than when judged against local trees of the same age and form.
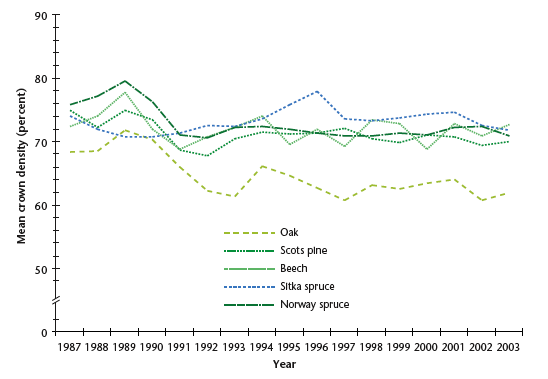
Figure 1 shows the changes in crown condition that have taken place since 1987. A ‘downward’ gradient in this figure indicates a ‘deterioration’ in crown condition. Alterations in condition compared with last year were minor for all of the surveyed species and not one of the changes was statistically significant. However, relatively large fluctuations in crown density (more than 3% to 4%) between years are required for the statistical significance of such differences to be established. Short-term variations of this magnitude are infrequent in all of the surveyed species except beech, the condition of which has been characterised by large inter-annual changes in crown density over the 15-year survey period. However, there is no evidence of a long-term trend for deterioration or improvement in the crown density of beech; similarly, no trend in the crown density of either Sitka spruce or Scots pine is apparent. For Scots pine, this represents a negation of the trend for deterioration which was reported in 2002 (Hendry et al., 2003) and has resulted from a single year of minor improvement in condition. In contrast, a minor deterioration in the crown density of Norway spruce in 2003 has re-established the trend for deterioration of the species which was evident in 2000 and 2001 but not in 2002 (Hendry et al., 2001, 2002, 2003).
Analysis of the 1987-2003 data also indicates that a statistically significant deterioration in the crown condition of oak has occurred over the duration of the survey. However, the time series is of relatively short duration and the indicated rate of change is small, with an apparent reduction in crown density of 0.48% per annum. The trend is heavily influenced by the high crown density values recorded in the period 1987 to 1990 when the number of survey plots of this species was relatively low. Caution should therefore be exercised in the interpretation of this result. The magnitudes of past increases in crown density in oak suggest that a single year of major improvement in condition could nullify the current trend.
The condition scores of Scots pine and Norway spruce have changed little since 1991 and have displayed only minor inter-annual changes during that period. The average difference between the crown density scores recorded in successive years is less than 1% for either species and a change of more than 2% has occurred on only one occasion. Over the same period, greater fluctuations in crown density have occurred in Sitka spruce. A sharp decline in the condition of this species in 1997 was followed by successive minor improvements between 1999 and 2001. However, the recovery was completely reversed in 2002 and, after a further slight deterioration in 2003, its condition is currently at the poorest level recorded since 1991. The crown density of oak increased slightly in 2003, partially offsetting the deterioration recorded in 2002. The condition of beech also improved in 2003 and it is currently the only surveyed species with a higher crown density than it displayed at the inception of the survey in 1987.
Table 1: Percentages of trees in each crown density class for five species in 2003. Each 10% class represents a reduction in crown density compared either to an ‘ideal tree’, i.e. a tree with the maximum possible amount of foliage, or to a ‘local tree’ (L), i.e. a tree with full foliage under local conditions.

Figure 1: Changes in crown density since 1987 for five species surveyed annually. The crown density compared with that of an ‘ideal’ tree with a completely opaque crown is shown for each species.

Figure 2 shows the geographical variation in crown density for the five species assessed. The condition of oak was highly variable but poor in Scotland, northeast England, mid-Wales and the central belt of east England. Crown densities were particularly low across central Scotland where high levels of defoliation have been recorded in oak for several consecutive surveys. As in previous years, the condition of Scots pine tended to be in better in the region south of the Humber-Mersey line. No clear pattern was evident for Norway spruce. Sitka spruce was poorest in southwest England, but this impression is created by relatively few plots and there is considerable local variation in the condition of the species. Although the condition of beech was generally good, lower crown densities were recorded in southern and central Scotland, the East Midlands and the southern reaches of east England than elsewhere. A reasonable correspondence can be detected between the 2003 condition map for beech shown here, and the areas identified as climatically suitable for the growth of this species in Britain by Ray et al. (2002).
The autumn of 2002 was generally wet and, although October was cool, temperatures were warmer than average over the entire UK in November. December continued wet in most parts of the country. While rainfall and temperature levels in January 2003 were close to their long-term averages in most localities, the period from February to April was unusually warm, dry and sunny. May 2003 was warm but unseasonably wet and the dull conditions which characterised the early part of the month contributed to a general lack of damaging spring frosts. Summer was unusually hot, with the mean June temperature being the highest recorded in England and Wales since 1976. However, rainfall in June and July was close to average and it was only in August that the exceptionally dry conditions which prevailed until the end of October began. As a result, few acute symptoms of water deficit were noted on trees during the course of the growing season.
The marked decline in the condition of oak which occurred in 2002 was partially offset by an increase in crown density in 2003. Although relatively modest, the improvement in condition which occurred this year has only been exceeded in magnitude on three occasions during the survey’s 17-year history. At the level of individual trees, 46.5% of the sampled oak population improved in condition, 21.5% displayed no change in crown density and the condition of 32% of trees deteriorated. Of those trees which improved in condition, the majority (71%) displayed increases in crown density of only 5 to 10%. As in 2002, the magnitude of these differences was insufficient to relate the overall improvement of the species to changes in the incidence or severity of biotic and abiotic damage to trees.
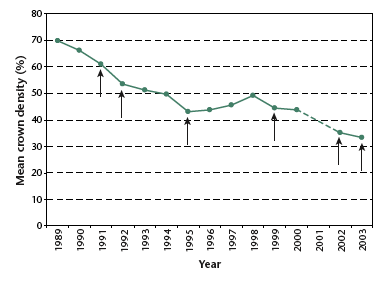
The most important damage to oaks in 2003 was caused by defoliating insects, the actions of which were recorded in 59 of the 63 plots assessed. In most cases such damage was minor in extent but in certain plots, particularly those located in northwest England and southern/central Scotland, attacks by the winter moths Operophthera brumata and Erranis defoliaria were severe. The oak plot in central Scotland with the lowest average crown density recorded in Britain this year (which appears within the red area of the appropriate map in Figure 2) has suffered consecutive defoliations of varying severities over the past 8 years. The average crown density for this plot has steadily declined from 69.8% in 1989 to 33.4% in 2003 (Figure 3). Elsewhere, oak dieback (Gibbs, 1999) was identified as the primary cause of poor condition in five plots. However, less damage due to powdery mildew (Microsphaera alphitoides) was recorded in 2003 than in recent years, a fact which may reflect the dry conditions which predominated throughout much of the growing season.
Figure 3: Changes in crown density since 1989 for a single oak plot in southern Scotland. Arrows indicate years in which severe defoliation by winter moth larvae has been recorded.

A marked decrease in the crown density of Sitka spruce last year was followed by a further slight decline in condition during 2003. After a relatively mild winter the population of Elatobium abietinum which had been responsible for much of the damage to the species in 2002 remained high and, in certain localities, aphids were found feeding on the current year’s foliage as early as June 2003. However, the incidence and severity of damage were generally reduced this year, with active aphid attacks reported from 50% of plots compared with the 72% affected in 2002. In spite of this, the recovery of spruces from needle loss is slow and it may take several seasons for the crown densities of trees defoliated in the last two years to fully recover.
In 2003, Norway spruce was also defoliated by Elatobium abietinum but it is less susceptible to attack than Sitka spruce and damage was consequently minor. Bud blight and subsequent distortion of the branching pattern of trees as a result of infection by the pathogen Cucurbitaria piceae were more commonly recorded in 2003 than in previous years, with records from 27 of the 54 plots assessed. Infections of sufficient severity to reduce the crown densities of trees were, however, only apparent in 5 plots. Of the conifers assessed in the survey, only Scots pine displayed an improvement in condition in 2003. The increase in crown density for the species was slight and levels of damage from living and non-living agents were largely unchanged from those recorded in 2002. Attacks by the pine shoot beetle Tomicus piniperda were common but minor in extent, and symptoms of water deficit in the form of premature senescence of older needles were confirmed in only 2 cases.
The greatest improvement in condition during 2003 occurred in beech, the crown density of which increased by 1.8% compared with 2002. Insect damage, which was mostly attributable to the beech leaf miner Rhynchaenus fagi, was widespread and recorded in 62 of the 65 plots assessed this year. However, the severity of such damage was much lower than last year with the proportion of trees in which attack was scored as common or abundant having reduced from 23.6% in 2002 to 12.4% in 2003. In beech, poor crown condition is often associated with heavy mast formation while crown density is generally higher in years when fruiting is light or absent (Hendry et al., 2001). The relationship between these factors was again evident this year, with mast production being scarce or absent in 91.6% of trees. In spite of the sensitivity of beech to drought, overt symptoms of water deficit in the form of premature leaf senescence and leaf fall were recorded in only six plots located in the southeast of England.
The 2003 growing season was both drier and warmer than average in most parts of the United Kingdom. However, May was unseasonably wet and the driest conditions of the year were not encountered until August. As a result, few acute symptoms of water deficit were noted on trees during the course of the survey. Changes in crown density with respect to 2002 were minor in all of the assessed species, but there was an overall improvement in the condition of trees this year, due largely to reduced levels of defoliation in the broadleaves. Slight reductions in the crown densities of both Sitka spruce and Norway spruce were largely attributable to defoliation by the green spruce aphid Elatobium abietinum. The insect caused severe defoliation of Sitka spruce in 2002 and continued damage this year may be due to the survival of relatively large populations of the aphid through the mild winter and spring of 2003. A slight increase in the crown density of Scots pine was not clearly related to any change in the levels of damage from living and non-living agents. Insect damage to oak was widespread in 2003 but generally of low severity and the crown density of the species displayed improvement of a magnitude which has only been exceeded on three previous occasions. As a result of light mast formation and reduced levels of insect damage, the condition of beech improved this year and it is currently the only surveyed species with a higher crown density than it displayed at the inception of the survey in 1987.