Summary
Understanding and quantifying the carbon and greenhouse gas (GHG) balance of the UK’s woodlands and forests is a key part of our programme on forestry and climate change mitigation. A major part of the experimental work is focussed on quantifying the carbon dioxide and other greenhouse gas uptake and losses from a planted oak woodland within the Alice Holt Research Forest. Measurements of carbon dioxide, water vapour and energy exchange (or fluxes) commenced in March 1998 at the Straits Inclosure, in addition to numerous other assessments at the site, linked to the Intensive Forest Monitoring Network and the Environmental Change Network. The Straits Inclosure flux site is currently the only active long-term carbon dioxide flux monitoring site in woodland in the UK.
Research Objectives
- To quantify the carbon balance of the woodland ecosystem and its main components (soil, trees, understorey vegetation)
- To understand how this may be affected by climate variation and management regimes
- To provide detailed measurements for the development and evaluation of models of forest growth and productivity, that can be used to assess the likely impacts of climate change and management
General Content
The Site
The carbon dioxide flux measurement site is located within the Straits Inclosure, Hampshire, UK. This is a commercially managed, lowland oak forest where the main tree species is Quercus robur L. The understorey is dominated by hazel (Corylus avellana L.) and hawthorn (Crataegus monogyna Jacq.). The eastern half of the site was thinned in 2007 and the western half in 2015.
The measurement system
Quantifying the carbon balance of the forests requires measurements of the exchange of carbon dioxide between the air passing over the forest and the forest vegetation, using micrometeorological methods. Techniques and instruments available since the late 1980s allow us to measure the rapid turbulence in the air (or ‘eddies’), and the fluctuations in the carbon dioxide concentration to see how they ‘co-vary’ (vary together). We can then calculate the net exchange upwards (when the forest is termed a ‘source’ of carbon dioxide, for example at night) and downwards (when the forest is a sink, for example on a sunny summer day).
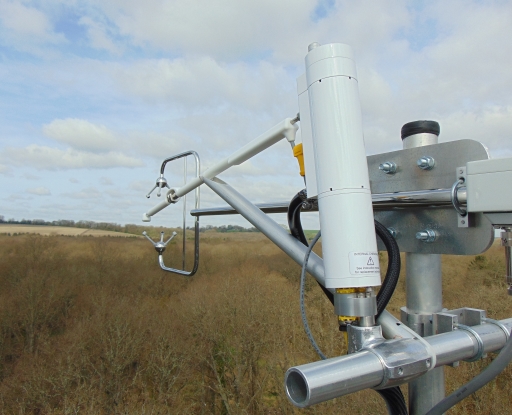
The instruments are mounted above the trees on a tall tower located within the 90ha plantation. These include a high-speed anemometer (using the speed of sound to measure the turbulence) and an infra-red gas analyser (measuring fluctuations in atmospheric carbon dioxide concentration). From very rapid (20 times a second) measurements half-hour average fluxes of carbon dioxide are continuously computed in all weather conditions. An automatic weather station (AWS) mounted at the same height provides data on changes in environmental conditions such as air temperature, light levels and relative humidity etc. In addition, digital cameras are also used to automatically record change in canopy leafiness (‘phenocams’).
Results
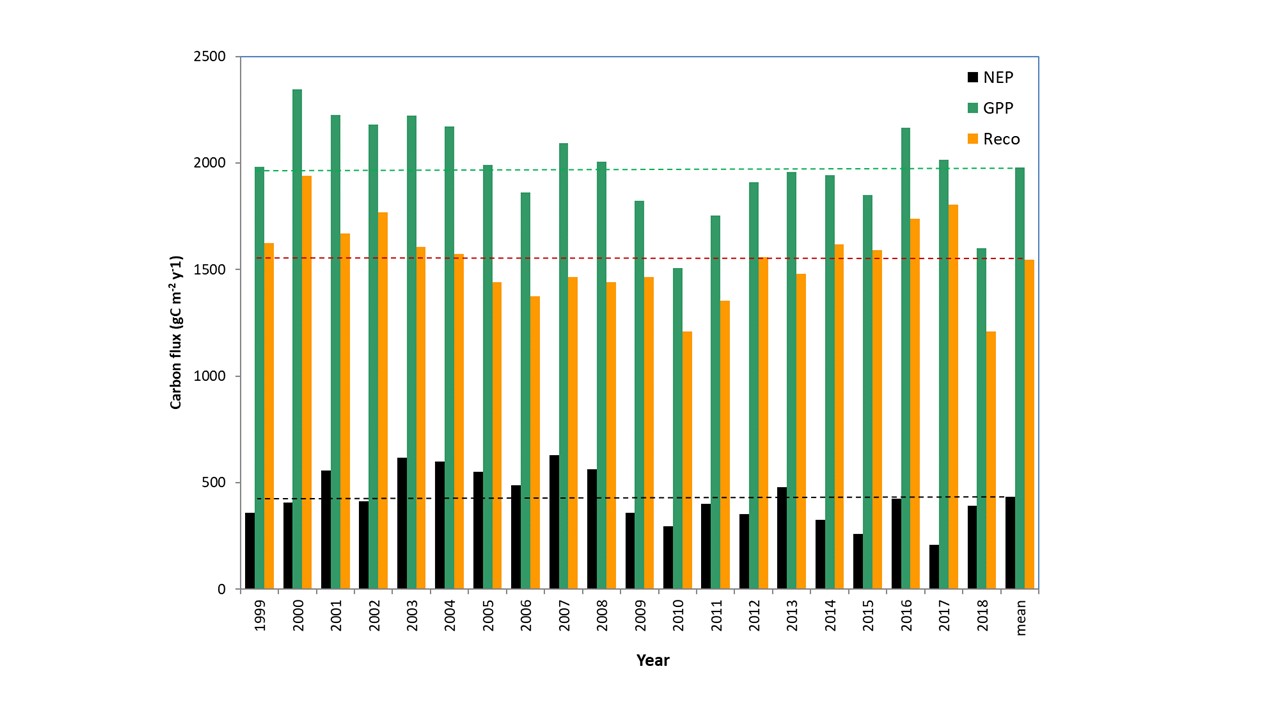
The graph below shows the annual partitioned carbon dioxide flux components. From the onset of monitoring in 1998, the mean annual NEP (Net Ecosystem Productivity) has been 4.8 tC/ha/yr, indicating that overall, this woodland is acting as a strong sink for carbon.
Straits forest floor carbon dioxide fluxes
Summary
This project measures the carbon dioxide (CO2) released from the forest floor at the Straits Inclosure in Alice Holt Forest. This work supports our research into understanding forest carbon balances and the effects of woodland management.
Research objectives
- Quantify the CO2 release from the forest floor of a temperate oak forest in southern England (including both the soil and leaf litter components).
- Understand the effects of environmental change and weather on the CO2 release from the forest floor.
- Provide data on forest floor CO2 release for woodland carbon balance modelling (for example, to assess the possible climate change impacts).
Results so far
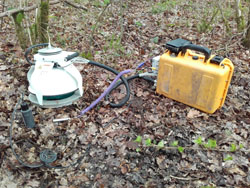 Two sets of measurements are collected in this project. At five points in the forest the soil CO2 release from the forest soil (without leaf litter) is measured. From a further five points the CO2 from the combined soil and leaf litter is measured. These measurements are taken weekly using a LI-COR Instruments LI-8100A analyser and 20 cm survey chamber.
The results from this long-term monitoring of forest soil CO2 fluxes have shown that there is a distinct annual cycle. Soil CO2 fluxes are larger in the summer and smaller in the winter, probably driven by the temperature and soil moisture, and by changes in root activity.
Previous studies at this site have also measured the CO2 released from the forest floor. Heinemeyer et al. (2012) found that the annual rate of CO2 released was 740 ± 43 g C m-2 yr-1 and Yamulki & Morison (2017) reported 894 g C m-2 yr-1.
The gross rate at which the forest in the Straits Inclosure took up CO2 (1999-2010) was 2034 ± 145 g C m-2 yr-1. In the same period, the rate of CO2 released by the Straits Inclosure was 1548 g C m-2 yr-1(Wilkinson et al., 2012). The previous studies have therefore shown that the CO2 released from the soil is equivalent to 48-58% of the total CO2 leaving this forest.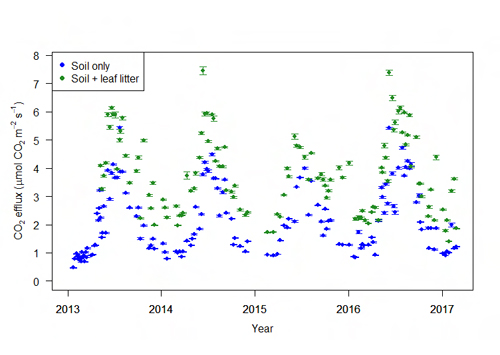
The graph above shows the mean CO2 released from the soil (blue) and the soil and litter combined (green), as measured by this project since 2013. Error bars are ± 1 standard error.
The current project is continuing to add measurements to our dataset. These measurements, in addition to those from the eddy covariance tower, will help improve our understanding of the amount of CO2 coming from the soil and what drives the processes that produce it.
Status
This project started in 2013 and is ongoing.
Funding and Partners
This project is part of the Assessing Resilience research programme.
Forestry Commission Policy
The project supports FC policy by investigating how forests help us address climate change, and policies on sustainable forest management. This includes those addressing protecting forests and the ecosystem services they provide, such as carbon storage in the soils, carbon sequestration in growing trees, and wood provision for timber and biomass markets. The work addresses knowledge gaps about quantifying the carbon balance of forests and the effect of disturbance, and helps underpin the values used in the Woodland Carbon Code.
Journal publications
Pinnington, E.M., Casella, E., Dance, S.L., Lawless, A. S., Morison, J.I.L., Nichols, N.K., Wilkinson, M. and Quaife, T.L. (2016). Investigating the role of prior and observation error correlations in improving a model forecast for forest carbon balance using Four-dimensional Variational data assimilation. Agricultural and Forest Meteorology 228: 299-314.
Wilkinson, M., Crow, P., Eaton, E.L. and Morison, J.I.L. (2016). Effects of management thinning on CO2 exchange by a plantation oak woodland in south-eastern England. Biogeosciences 13: 2367-2378.
Wingate, L., Ogée, J., Cremonese, E., Filippa, G., Mizunuma, T., Migliavacca, M., Moisy, C., Wilkinson, M., Moureaux, C., Wohlfahrt, G., Hammerle, A., Hörtnagl, L., Gimeno, C., Porcar-Castell, A., Galvagno, M., Nakaji, T., Morison, J. Kolle, O., Knohl, A., Kutsch, W., Kolari, P., Nikinmaa, E., Ibrom, A., Gielen, B., Eugster, W., Balzarolo, M., Papale, D., Klumpp, K., Köstner, B., Grünwald, T., Joffre, R., Ourcival, J.-M., Hellstrom, M., Lindroth, A., George, C., Longdoz, B., Genty, B., Levula, J., Heinesch, B., Sprintsin, A., Yakir, D., Manise, T., Guyon, D., Ahrends, H., Plaza-Aguilar, A., Guan, J. H. and J. Grace (2015). Interpreting canopy development and physiology using a European phenology camera network at flux sites. Biogeosciences 12: 5995-6015.
D’Odorico, P., Gonsamo, A., Gough, C.M., Bohrer, G., Morison, J., Wilkinson, M., Hanson, P.J., Gianelle, D., Fuentes, J.D. and Buchmann, N. (2015). The match and mismatch between photosynthesis and land surface phenology of deciduous forests. Agricultural and Forest Meteorology 214-15: 25-38.
Xia, J., Niu, S., Ciais, P., Janssens, I., Chen, J., Ammann, C., Arain, A., Blanken, P.D., Cescatti, A., Bonal, D., Buchmann, N., Curtis, P.S., Chen, S., Dong, J., Flanagan, L.B., Frankenberg, C., Georgiadis, T., Gough, C.M., Hui, D., Kiely, G., Li, J., Lund, M., Magliulo, V., Marcolla, B., Merbold, L., Montagnani, L., Moors, E., Olesen, J.E., Piao, S., Raschi, A., Roupsard, O., Suyker, A.E., Urbaniak, M., Vaccari, F.P., Varlagin, A., Vesala, T., Wilkinson, M., Weng, E., Wohlfahrt, G., Yan, L., Luo, Y. (2015). Joint control of terrestrial gross primary productivity by plant phenology and physiology. Proceedings of the National Academy of Sciences of the United States of America. Vol 12 no. 9: 2788-2792. DOI:10.1073/pnas.1413090112.
Ward, H.C., Kotthaus, S., Grimmond, C.S.B., Bjorkegren, A., Wilkinson, M., Morrison, W.T.J., Evans, J.G., Morison, J.I.L. and Iamarino, M. (2014). Effects of urban density on carbon dioxide exchanges: observations of dense urban, suburban and woodland areas of southern England. Environmental Pollution 198: 186-200. DOI:10.1016/j.envpol.2014.12.031
Wilkinson, M., Eaton, E.L., Broadmeadow, M.S.J. and Morison, J.I.L. (2012). Inter-annual variation of carbon uptake by a plantation oak woodland in south-eastern England. Biogeosciences 9: 5373-5389.
Mizunuma, T., Wilkinson, M., Eaton, E.L., Mencuccini, M., Morison, J.I.L. and Grace. J. (2012). The relationship between carbon dioxide uptake and canopy colour from two camera systems in a deciduous forest in southern England. Functional Ecology 27:196-207.
Heinemeyer, A., Wilkinson, M., Vargas, R., Subke, J.-A., Casella, E., Morison J.I.L. and Ineson, P. (2012). Exploring the “overflow tap” theory: linking forest soil CO2 fluxes and individual mycorrhizosphere components to photosynthesis. Biogeosciences 9: 79–95.
Nagai, S., Akitsu, T., Saitoh, T.M. et al. (2018). 8 million phenological and sky images from 29 ecosystems from the Arctic to the tropics: the Phenological Eyes Network Ecol Res.
Wilkinson, M., Eaton, E.L. and Morison, J.I.L. (2018). Can upward-facing digital camera images be used for remote monitoring of forest phenology? Forestry: An International Journal of Forest Research 91: Issue 2, 217–224.
Ilie, I., Dittrich, P., Carvalhais, N., Jung, M., Heinemeyer, A., Migliavacca, M., Morison, J.I.L, Sippel, S., Subke, J.-A., Wilkinson, M., and Mahecha, M.D. (2016). Reverse engineering model structures for soil and ecosystem respiration: the potential of gene expression programming. Geoscientific Model Development Discussions.