Summary
Leaf area
Differences in leaf area between the four communities are apparent, with the contribution from hazel to total leaf area highest in the Tall shrub community. The effect of recent thinning in the remaining three communities is apparent, with leaf area in the Level II community twice that in both the Mast and Open communities, reflecting thinning of the former in 1995, as opposed to 1997 for the two latter plots.
The summary data shown in the figures below clearly demonstrate the seasonal patterns of leaf growth for each plant group and for each community. Sampling in May 1999 was coincident with the leaf flush of hazel, which is reflected in its large contribution to the early data. It is clear that the ground flora (grasses, herbs, ferns, sedges and rush), formed a significant proportion of the understorey in all communities except the Tall Shrub, on an annual basis, making up 40% of leaf area in the Open and Mast communities, and 15 to 20% in the Level II community.
Leaf area of the herbaceous ground vegetation exceeded that of both the climbers and the short woody shrubs categories, particularly in May and July. However, the dominant tall shrub species (i.e. hazel and hawthorn) formed between 20 and 90% of total understorey leaf area during the majority of the growing season, reaching 2.0 m2/m2 in July in the Open, Level II and Mast plots, and 3.6 m2/m2 in the Tall shrub community.
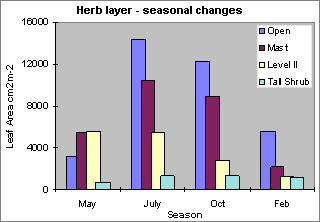
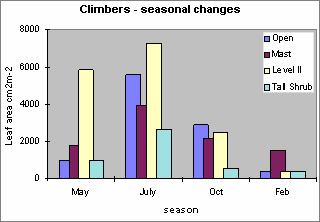
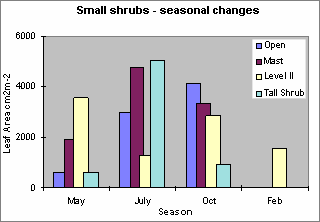
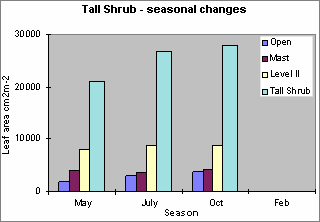
Figures above show the total contribution to green leaf area for each community and at each time of sampling.
Biomass – contribution of woody shrubs to understorey biomass
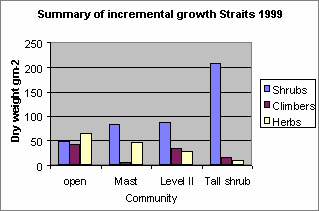
The estimates of standing hazel biomass for the different vegetation communities reflects the effect of management on the composition of the understorey. The dominant growth of hazel results in a contribution of almost 50% to NPP, as determined by eddy correlation flux measurements. Incremental growth for other woody species are summarised in the table below – these species form a significant but highly variable proportion of understorey biomass in the Mast and Level II plots.
In May 1999, woody shrubs (excluding hazel) constituted approximately 40 % of the standing understorey biomass in these communities (see table below). In the Tall shrub community, only hawthorn was present. The biomass of climbers is greatest in the Level II plots, but incremental growth is largest in the Open community as a result of the higher solar radiation input. Maximum climber biomass was recorded for all communities in July.
| Shrub biomass (g m2) | Climbers (g m2) | Total (g m2) | ||||||
|---|---|---|---|---|---|---|---|---|
| Corylus | Crataegus | Rosa | Fraxinus | Rubus | Lonicera | Hedera | ||
| Open | 17.8 | 12.4 | 17.6 | 0.7 | 15 | 25.6 | 2.1 | 93.5 |
| Mast | 40 | 18.3 | 4.4 | 21.7 | 5.8 | 0 | 0.8 | 94.5 |
| Level II | 64.2 | 17.9 | 4 | 2.3 | 23.5 | 11.1 | 0.3 | 136.5 |
| Tall shrub | 178.3 | 25.8 | 3.8 | 0.8 | 7.1 | 9.6 | 0 | 225.3 |
Biomass – contribution of non-woody species to understorey biomass
Low growing herbs and grasses form an important component of the understorey biomass in the Open and Mast communities. In the former, the dominance of the grasses is evident, with the late development of Deschampsia flexuosa in October.
For other grasses, maximum biomass was recorded in May and July which was coincident with a closing canopy above. Although the biomass of the remaining categories of non-woody plants is small, the mass of herbaceous species almost equals the grasses in the species rich Mast and Level II communities. Sedge is an important constituent in all communities.
The contribution from each of the plant groups to the herbaceous ground vegetation is shown below.
See also Intensive long term monitoring of forest ecosystems
