Research
Transformation to continuous cover forestry
Research Status:current
Once you have collected and processed the stand level data the next step is to use it to understand what is happening in the stand and then to specify silvicultural interventions. At a recent workshop in North West England Forest District a group of pioneers met to share their experience. This experience suggested that the main benefits from monitoring covers:
Stand level data displayed by a GIS:
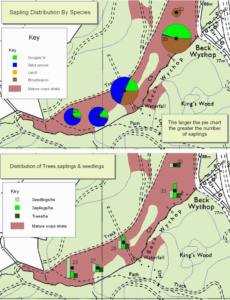
Objective information is produced on species composition, size, distribution and browsing damage on regeneration. This is useful because many forest managers:
Screenshot displaying diameter distribution:
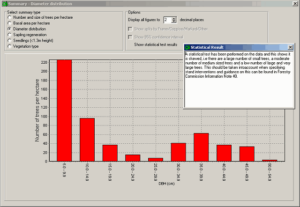
Objective information is presented on species composition, basal area and diameter distribution of stands. This can be useful for two main reasons:
The results of monitoring can be used to present a professional approach to Continuous Cover Forestry management to potential or existing clients, team members or external contacts.
This information was first published in the January 2005 edition of Forestry and British Timber.
Mason, B. and Kerr, G. (2004) Transforming even-aged conifer stands to continuous cover management. Forestry Commission Information Note 40 (Revised). Forestry Commission, Edinburgh.
Kerr, G., Mason, B., Boswell, R. (2003) A sampling system to monitor the transformation from even-aged stands to continuous cover. Forestry, 76(4): 425-435.
Kerr, G. (2002) Uneven-aged silviculture: putting ideas into practice. Quarterly Journal of Forestry, 96(2):111-116.
Kerr, G., Mason, B., Boswell, R. & Pommerening, A. (2002) Monitoring the transformation of even-aged stands to continuous cover management. Forestry Commission Information Note 45. Forestry Commission, Edinburgh.
Mason, B., Kerr, G. and Simpson, J. (1999) What is Continuous Cover Forestry? Forestry Commission Information Note 29. Forestry Commission, Edinburgh. 8pp.

Software to support the transformation to Continuous Cover Forestry is available free from Forest Research.
The crucial first step to collect the data is to stratify the area into blocks that have common site factors and are to be managed as a single unit. In general the bigger the better as this will help reduce costs. Within each block, data are collected from fixed-area plots where the plot area is selected to assess a minimum number of trees.
 Locating plots on a systematic grid within each block where data is to be collected
Plots are located on a systematic grid covering the whole area and can be located using a compass and pacing.
The plots can be temporary or permanently marked depending on a number of factors; most people who have used the system so far feel that the advantages of permanent plots outweigh their disadvantages.
The main assessments in each plot are:
Saplings are woody plants at least 130 cm in height and less than 7 cm diameter at breast height. Saplings are important because given good silviculture there is a greater than 90% chance of them surviving to maturity.
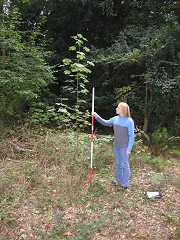
Nomenclature and size criteria for seedlings, saplings and trees
| Diameter at breast height (cm) | Height (cm) | |
|---|---|---|
| Seedling | n/a | <130 |
| Sapling | <7 | ≥130 |
| Tree | ≥7 | ≥130 |
Once the data have been collected they can be processed and examined using the software developed by Forest Research.
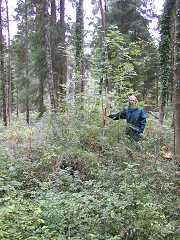
In the development of the software, the opportunity has been taken to allow other information concerning the transformation of an area to be recorded alongside the monitoring data. Hence the system allows the transformation plan, diary notes, fixed-point photographs and information on stand location to be stored.
The software enables information on the following to be displayed:
For example:
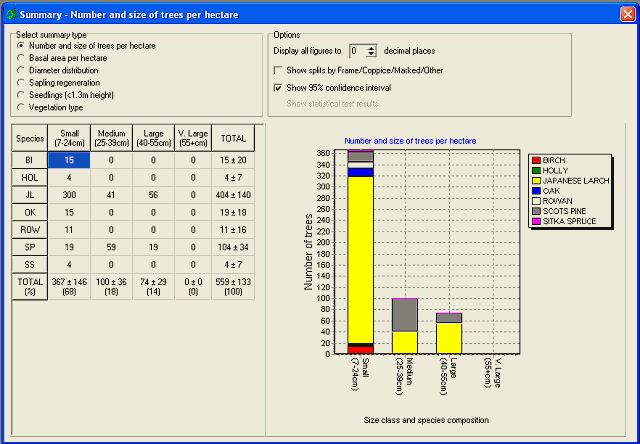

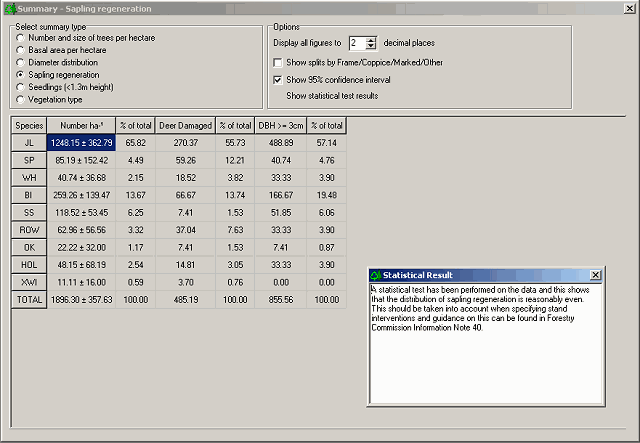
The above screenshots illustrate data from a stand with an overstorey of Scots pine and Japanese larch in Wykeham Forest, Yorkshire. The stand has a good structure for immediate introduction of Continuous Cover Forestry and the density and species composition of the saplings will ensure good recruitment of trees over the next 10 years assuming appropriate thinning.
This information was first published in the January 2005 edition of Forestry and British Timber
Monitoring the transformation of even-aged stands to continuous cover management
Forestry Commission Information Note 45 describes the approach in detail

Software to support the transformation to Continuous Cover Forestry is available free from Forest Research.

Monitoring the Transformation of Even-aged Stands to Continuous Cover Management
Forestry Commission Information Note 45 describes the approach in detail
Software to support the transformation to Continuous Cover Forestry is available free from Forest Research.