Tools and Resources
There was a total of 0.7 million green tonnes of UK hardwood deliveries in 2017 (Table 2.6). The majority of UK hardwood deliveries (81% in 2017) were used for woodfuel.
Table 2.6 Deliveries of UK-grown hardwood, 2008-2017
| Year | Sawmills | Pulp mills | Wood-based panels |
Woodfuel1 | Other2 | Total |
| thousand green tonnes | ||||||
| 2008 | 66 | 0 | 2 | 300 | 63 | 431 |
| 2009 | 76 | 0 | 1 | 400 | 59 | 536 |
| 2010 | 75 | 0 | 1 | 400 | 59 | 535 |
| 2011 | 81 | 0 | 1 | 400 | 59 | 541 |
| 2012 | 75 | 0 | 2 | 400 | 57 | 534 |
| 2013 | 74 | 0 | 0 | 400 | 58 | 532 |
| 2014 | 77 | 0 | 0 | 400 | 60 | 537 |
| 2015 | 76 | 0 | 0 | 400 | 91 | 566 |
| 2016 | 75 | 0 | 0 | 400 | 122 | 597 |
| 2017 | 66 | 0 | 0 | 600 | 71 | 738 |
Source: industry surveys, industry associations.
Notes:
1. Figures are based on processing industries’ purchases of hardwood grown in the UK and estimates for woodfuel and other uses.
2. Woodfuel reported here is derived from stemwood and includes estimated roundwood use for biomass energy.
3. The apparent increase in woodfuel from 2016 to 2017 reflects a new estimate of the level of hardwood deliveries for woodfuel and should not be interpreted as an increase in a single year. This figure is currently under review.
4. Other includes round fencing and roundwood exports.
Figure 2.2 Deliveries of UK-grown hardwood, 1994-2017
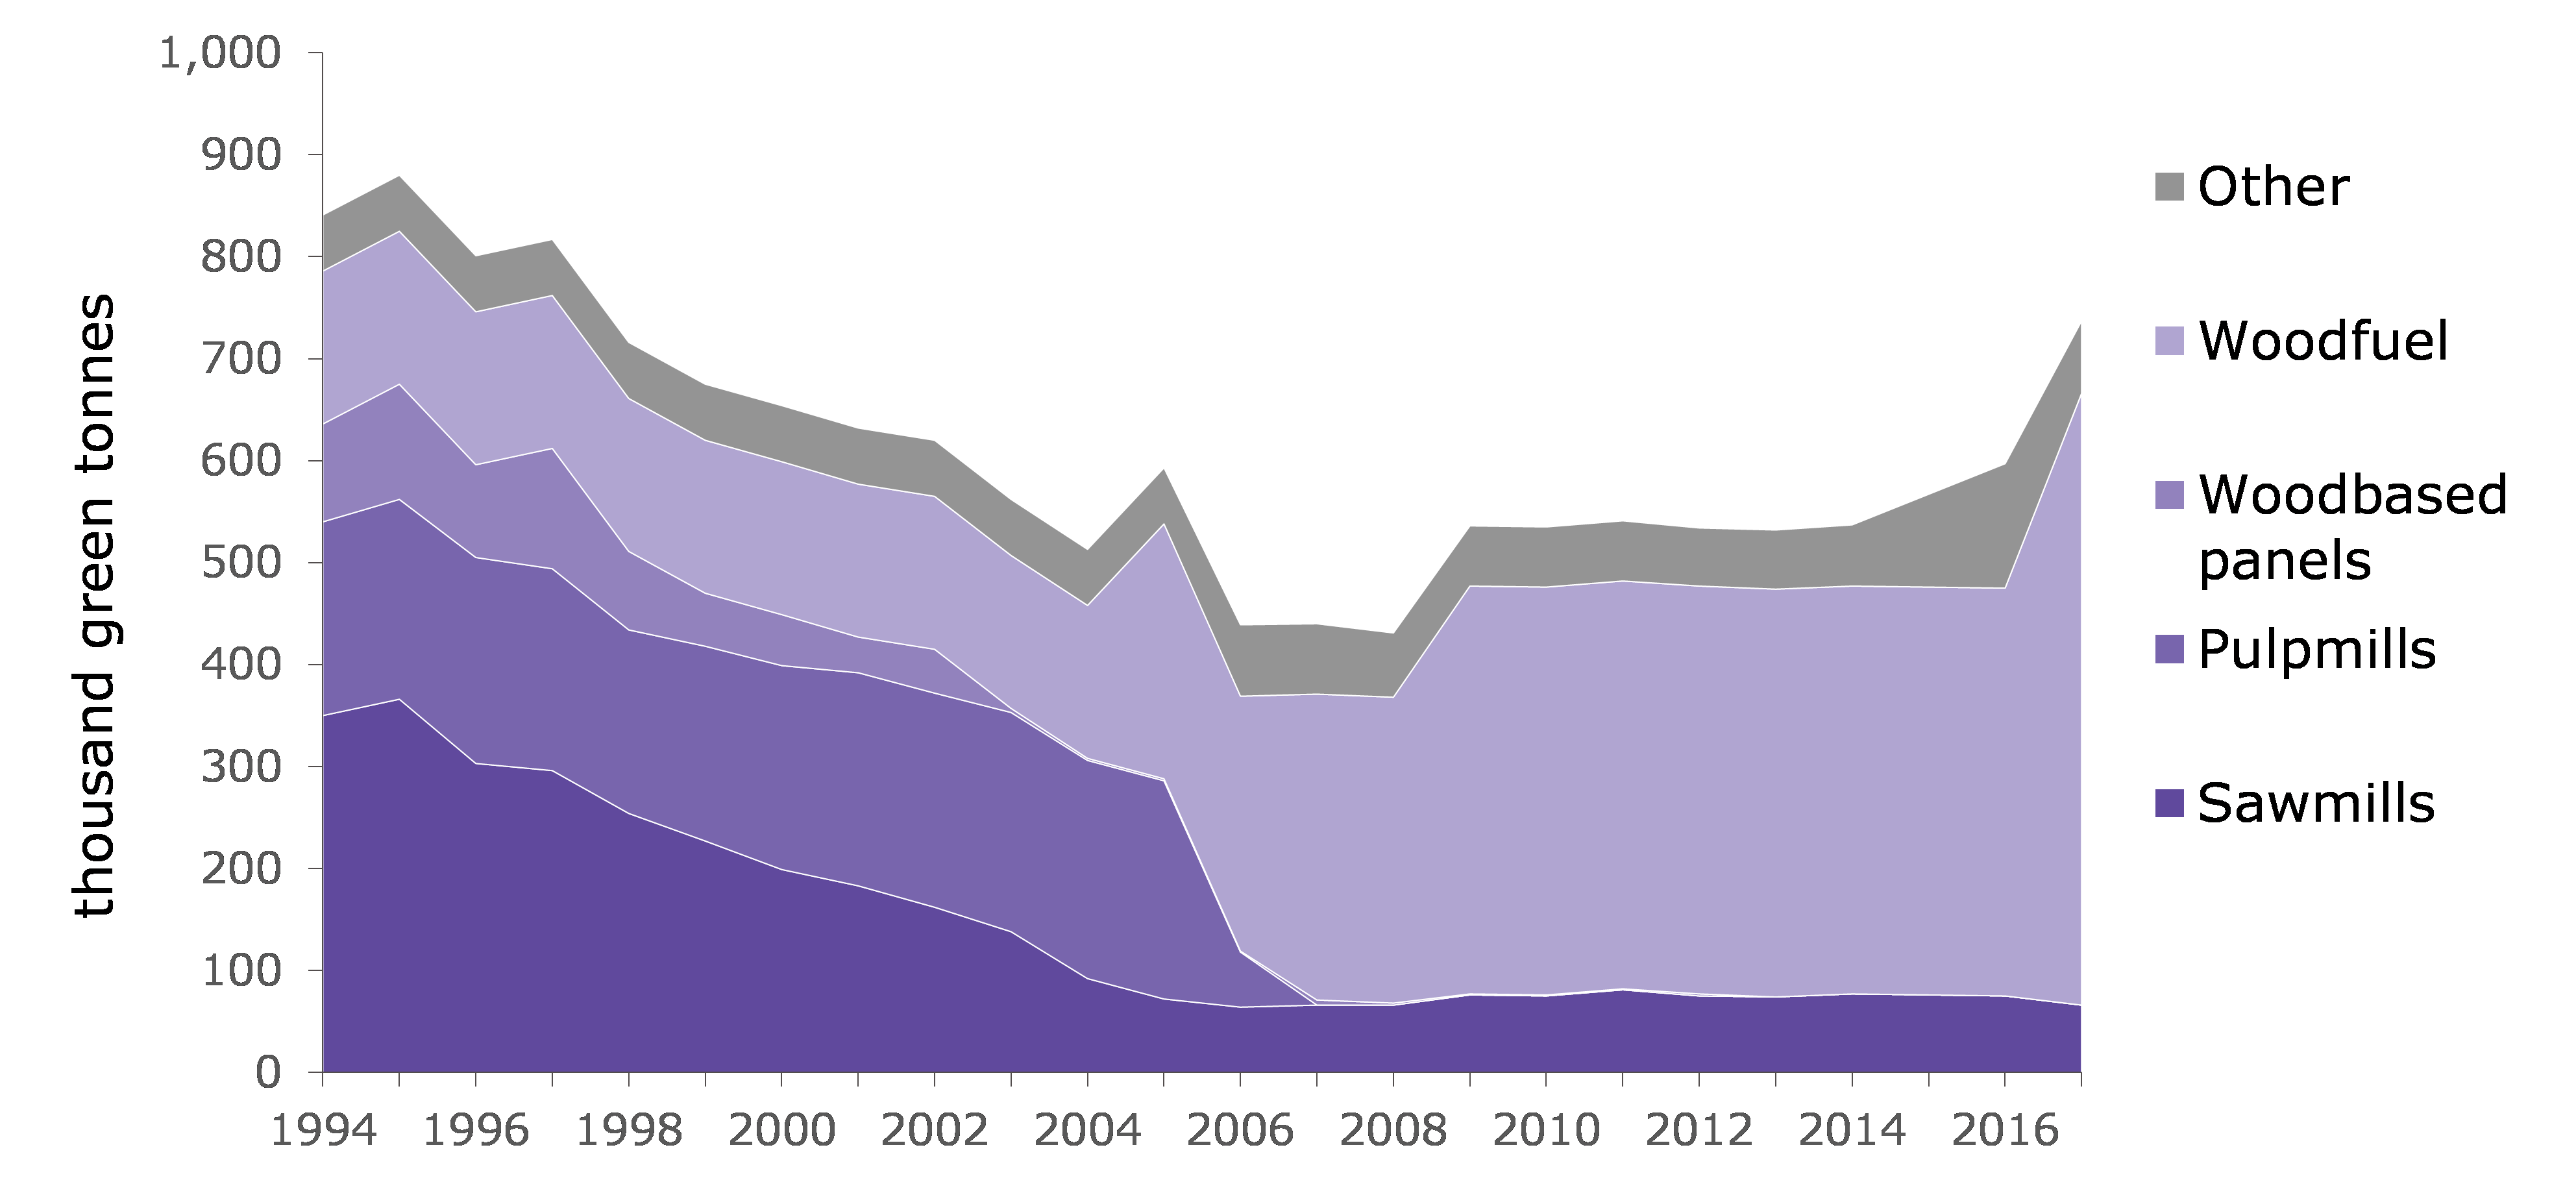
Source: industry surveys, industry associations.
Notes:
1. Other includes round fencing and roundwood exports.
2. The apparent increase in woodfuel from 2016 to 2017 reflects a new estimate of the level of hardwood deliveries for woodfuel and should not be interpreted as an increase in a single year. This figure is currently under review.
Sources chapter: Timber