Forest carbon sequestration is the process of increasing the carbon content of the forest through processes that remove carbon dioxide from the atmosphere (i.e. photosynthesis). Once sequestered the carbon is stored in the forest within living biomass, soil and litter and contributes to the forest carbon stock. The forest carbon sink describes the natural reservoir that accumulates and stores sequestered carbon. The forest carbon sink is dynamic and can gain (e.g. sequestration by photosynthesis) and lose (e.g. emission by forest fires) carbon. The forest carbon sink is quantified by measuring the net annual accumulation of carbon (carbon sequestration) by living biomass, soils and litter in forests.
The figures presented in Table 4.2 and Figure 4.2 represent the net annual accumulation of carbon dioxide by UK forests, taking into account carbon emissions due to forest wildfires and deforestation. Therefore, the actual figure for annual accumulation of carbon dioxide by UK forests will be far greater.
The net annual rate of carbon dioxide accumulation by UK forests is projected to fall from around 21 million tonnes CO2 in total in 2020 to around 19 million tonnes CO2 by 2030 (Table 4.2 and Figure 4.2).
Under the Kyoto protocol, additional woodland planted since 1990 contributes to the UK’s carbon dioxide emissions target. The general trend for the rate of accumulation of carbon in these new woodlands suggests an increase between 1990-2050 as woodland continues to be planted (Table 4.2).
Carbon in harvested wood products are not included in the figures shown in Table 4.2. and Figure 4.2 (but are included in overall greenhouse gas reporting).
Table 4.2 Net annual carbon dioxide sequestered by UK forests, 1990-2050
| Year |
In living biomass |
Total |
of which, due to land
afforested since 1990 |
emissions due to land
deforested since 1990 |
| million tonnes of carbon dioxide per year |
| 1990 |
12.3 |
15.0 |
-0.1 |
-0.2 |
| 1995 |
13.4 |
17.9 |
-0.5 |
-0.2 |
| 2000 |
14.0 |
19.8 |
-0.6 |
-0.8 |
| 2005 |
12.7 |
20.1 |
-0.4 |
-1.1 |
| 2010 |
11.6 |
21.0 |
0.4 |
-1.4 |
| 2015 |
10.9 |
21.3 |
1.9 |
-1.3 |
| 2020 |
10.9 |
20.5 |
3.7 |
-1.1 |
| 2025 |
10.0 |
20.2 |
5.5 |
-1.0 |
| 2030 |
8.9 |
19.3 |
7.0 |
-0.9 |
| 2035 |
8.9 |
18.6 |
8.2 |
-0.7 |
| 2040 |
9.5 |
18.7 |
8.1 |
-0.6 |
| 2045 |
9.8 |
18.9 |
7.3 |
-0.6 |
| 2050 |
9.4 |
18.9 |
6.6 |
-0.5 |
Source: Inventory and projections of UK emissions by sources and removal by sinks due to land use, land use change and forestry, produced by the Centre for Ecology and Hydrology (February 2018).
Notes:
1. Net annual accumulation of carbon in forests by woody biomass, soils and litter. Adjusted for losses from deforestation and forest wildfires. Excludes changes in UK harvested wood products.
2. Emissions and sequestration can be presented as tonnes carbon or tonnes carbon dioxide (CO2). To convert from tonnes CO2 to tonnes carbon multiply by 12/44.
3. Future predictions of carbon uptake assume that commercial conifer plantations will be replanted when felled, and that planting of new woodland will follow a central projection whereby planting up to 2020 is determined by the available grant for woodland creation (i.e. policy and funding in place), and after that planting rates drop to 10% of the baseline projection, reflecting the lack of funding beyond the current Rural Development Plan.
These figures are outside the scope of National Statistics. For further information see the Sources chapter.
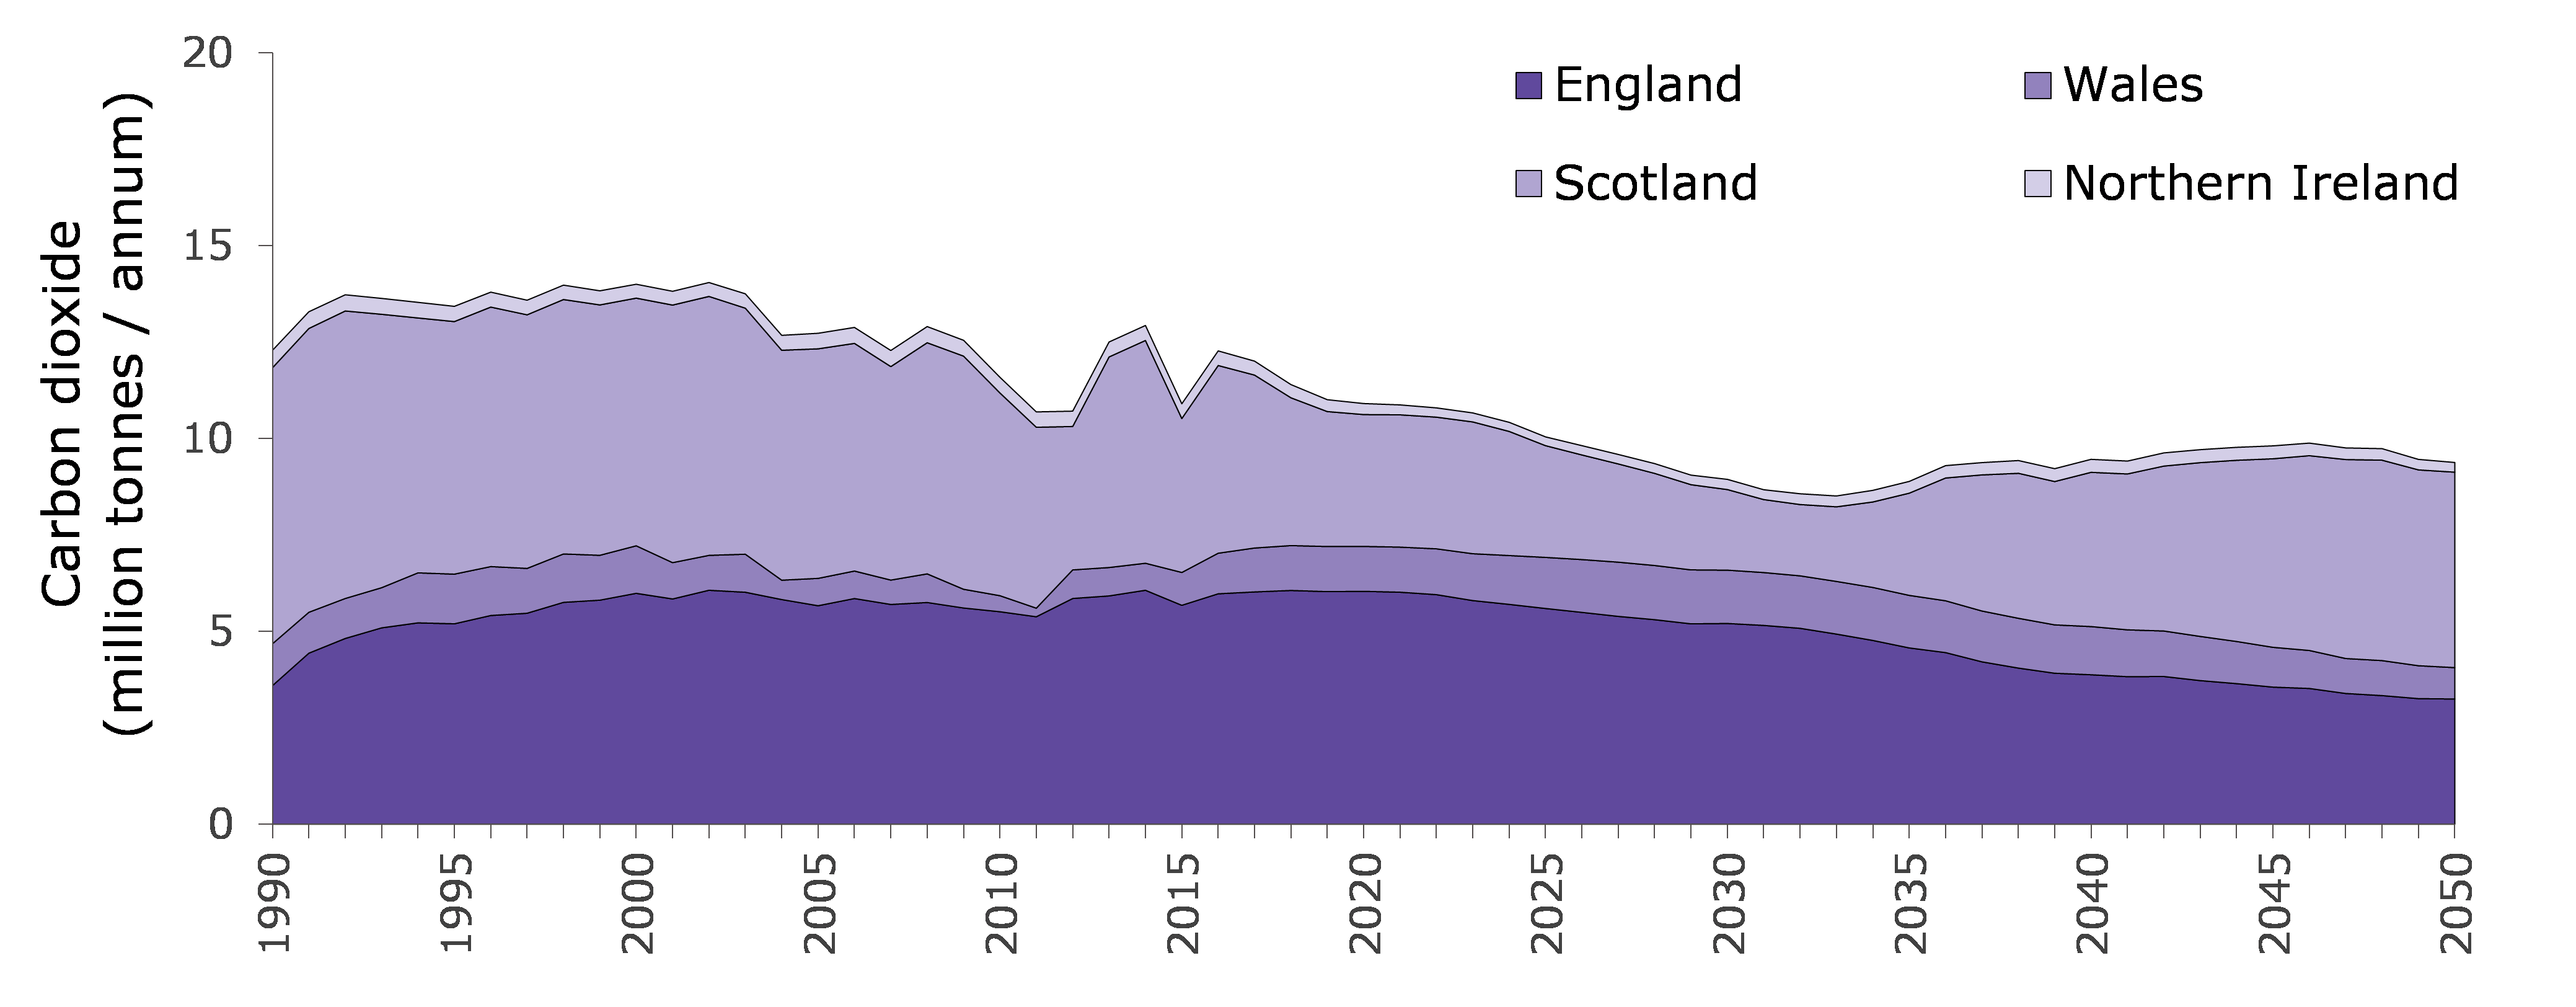
Figure 4.2 Net annual change in carbon (CO2 equivalent)1 in UK woodlands
Source: Inventory and projections of UK emissions by sources and removal by sinks due to land use, land use change and forestry, produced by the Centre for Ecology and Hydrology (February 2018).
Notes:
1. Net annual accumulation of living biomass only. Adjusted for losses due to deforestation and forest wildfires. Excludes changes in carbon in litter, soils and UK harvested wood products.
2. Emissions and sequestration can be presented as tonnes carbon or tonnes carbon dioxide (CO2). To convert from tonnes CO2 to tonnes carbon multiply by 12/44.
3. Future predictions of carbon uptake assume that commercial conifer plantations will be replanted when felled, and that planting of new woodland will follow a central projection whereby planting up to 2020 is determined by the available grant for woodland creation (i.e. policy and funding in place), and after that planting rates drop to 10% of the baseline projection, reflecting the lack of funding beyond the current Rural Development Plan.
These figures are outside the scope of National Statistics. For further information see the Sources chapter.